
After the close, is the bar getting longer or shorter
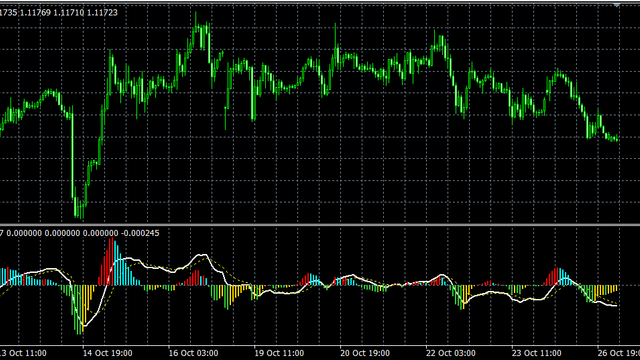
A closed-bar MACD read: longer is building, shorter is fading.
Direct answer
After a MACD histogram bar closes, compare its height with the previous closed bar. If this bar is longer, pressure is building. If it is shorter, pressure is fading. Four colors only name those two states above and below zero. You are not forecasting the next candle.
That comparison is the method. It does not say when to click. Divergence, arrows, and the next print are other questions. This note is the closed-bar read, not a click-by-click lesson.
How to judge
If a histogram color cannot pass these three checks, I do not treat it as information.
Did the bar close?
The forming bar is still moving. I still catch myself watching it. The rule uses the last completed histogram bar against the completed bar before that. Three to five closed bars are enough context. If you need the live tick, you are not using this read.
Is this bar longer or shorter than the last close?
Length is the quantity. Color is a legend. The histogram plots energy = (DIF − DEF) × 2. DIF is EMA(12) minus EMA(26). DEF is the EMA(9) signal of DIF. Longer than the previous closed bar means pressure in that direction is building. Shorter means it is fading. Red, aqua, green, and gold only name those two states above zero and below zero.
Would a range day still flip colors?
Yes. On a quiet, two-sided day the histogram still lengthens and shortens. Colors flip because small two-way noise keeps winning the last-bar comparison, not because a new trend arrived. That is the failure case. I do less work those days. I do not invent a trend so the pane feels useful.
Where the rule comes from
I have looked at this oscillator for more than fifteen years. I retired more tools than I kept. MACD stayed because the math is ordinary and the question is daily: after the close, is pressure increasing or decreasing?
The default MetaTrader histogram is one color. You can still compare height by eye. I paint four states so I stop guessing whether the last closed bar grew.
Above zero (bullish energy):
- Red — this closed bar is longer than the previous bullish bar → building
- Aqua — this closed bar is shorter → fading
Below zero (bearish energy):
- Green — this closed bar is longer (more negative) → downside building
- Gold — this closed bar is shorter → downside fading
Nothing in that list is an order. Multi-timeframe arrows on other charts are alignment flags, not entries.
I journal one line after the close. The shape is a skip or a caution, not a track record: aqua fade after red, H1 mixed. That sentence is a note I can reread tomorrow. It is not a sample of trades.
Screenshots
Two captures from 2026-10-27. Different hosts. Different feeds. Do not stack them into one bar.
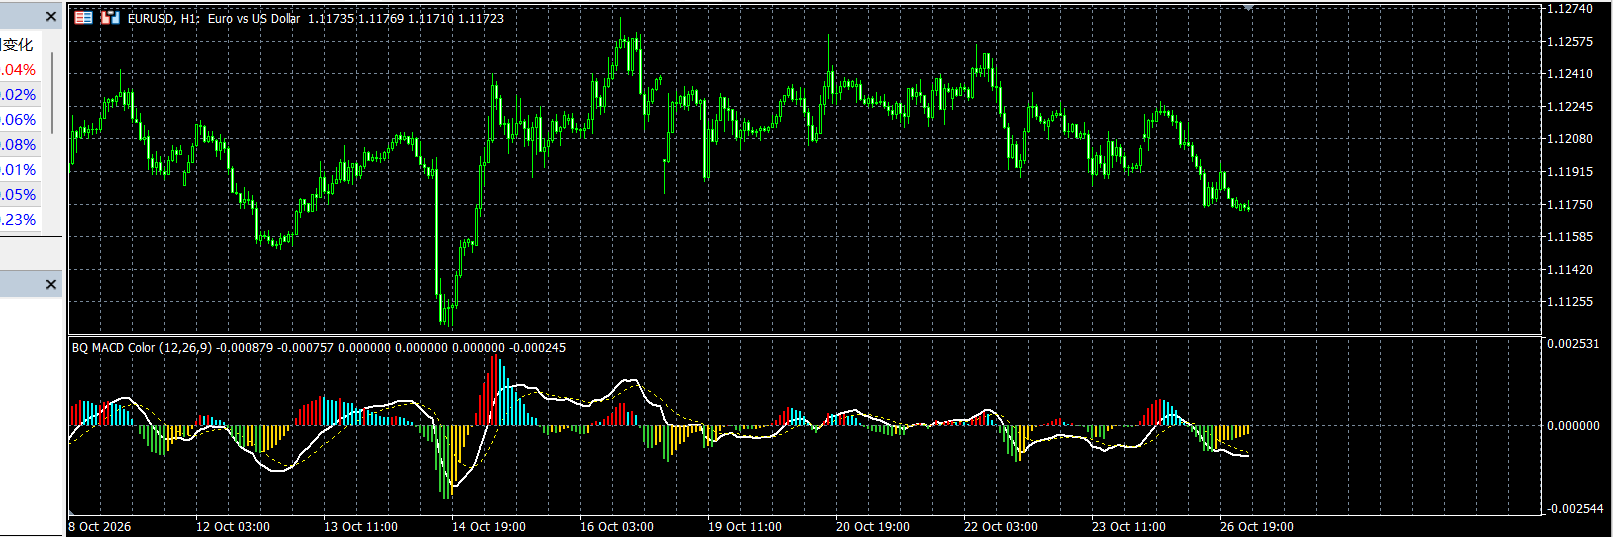
On that MetaQuotes-Demo hour the histogram shortened: 0.000198 on the previous closed bar, then 0.000100 at 2026-10-23 04:00 server time. In that cluster, 03:00 was the local peak. 04:00 faded. 05:00 faded further (0.000039). That is a closed-bar length comparison, not a reversal call.
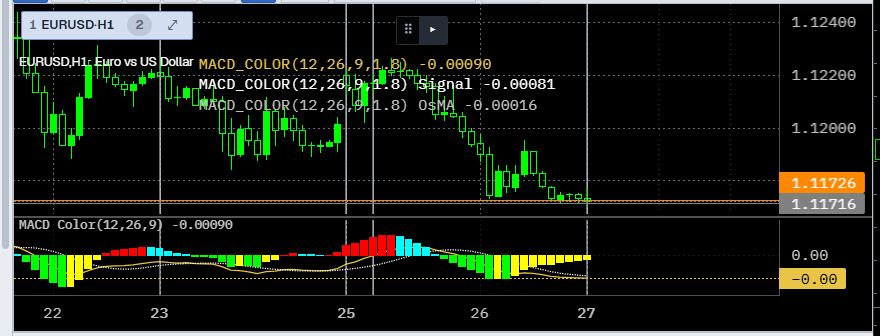
The Desktop sitting was a practice replay parked at the end of that window. End-bar readings on that capture: DIF −0.00090, signal −0.00081, OsMA −0.00016. Fast, slow, and signal are 12, 26, and 9 — the same periods as the MetaTrader formula. osma_mult 1.8 changes height only. It is not a second energy definition. Do not match −0.00016 to the 0.000198 / 0.000100 pair.
When the colors keep flipping
The read fails as a decision when the tape is a range, not when a color is “wrong.”
A range day still prints red then aqua then red. Below zero it still prints green then gold. Each closed bar is a bit longer or a bit shorter than the last. If I treat every flip as a new story, I work more on the days I should work less.
I also fail the read when I watch the forming bar, or when I treat aqua or gold after a strong red or green run as a late entry that must complete. Fading is fading. Mixing the two figures is another miss: one pane is MetaQuotes-Demo, the other is Dukascopy bid on a 97-bar H1 window. Same symbol, same period name, not the same print.
What we do
Method first. The Windows desk is where you rehearse. That window does not place live orders.
BarionQuant Desktop’s built-in MACD Color pane is a four-color MACD. The captured legend reads MACD_COLOR(12,26,9,1.8). The MACD pane starts at Standard. Free seats have MA and RSI, on H1 and daily. If you are on Free, take the rule from this page. Free has no MACD subwindow.
We ship Windows today. No Mac build. No browser replay. No twenty-year official tick tape. The installer does not include an order-placing script.
On 2026-10-27 the free MetaTrader 5 listing BarionQuant Macd Histogram 4 Color was live at mql5.com/en/market/product/182939 (https://www.mql5.com/en/market/product/182939). The page calls it an indicator only, with no trading logic. Same brand name, two different products — that cut is already public for tools that can send live orders. This histogram does not send them. The Desktop installer does not ship that Market file. You do not need it to understand the rule.
Who should skip
Skip this page if you want buy and sell arrows, a same-day direction, or a script that places orders. We do not publish that here.
Skip it if the rule is only real to you when a Free seat shows MACD.
Skip it if you need Mac, or a replay that runs in the browser. The desk is Windows.
Keep it if you already look at a MACD histogram and you want one closed-bar question you can write down before Play.
FAQ
Do I need four colors?
No. A one-color histogram still lengthens and shortens. Four colors are a legend for the same comparison.
Does a shorter bar mean reverse?
No. Fading means the last closed bar was shorter than the one before it. Price can keep walking. I treat that as caution or a skip, not as a reversal order.
Is the Desktop chart the 04:00 MetaQuotes bar?
No. The Desktop capture is Dukascopy bid, EURUSD H1, 2026-10-21 to 2026-10-27, 97 bars, osma_mult 1.8 for height. The shortened 04:00 print is MetaQuotes-Demo on a different window.
Next step
Download the Windows build if you want a local desk for the next sitting. Read why a finished chart still lies before you trust a pane you already scrolled. Score the sitting, not the paper P&L.
For study and simulated practice only. This is not investment advice.
Educational content. BarionQuant is not a broker and does not provide investment advice or trade signals. Past practice results do not predict future outcomes.