
Three checks before I keep a divergence line
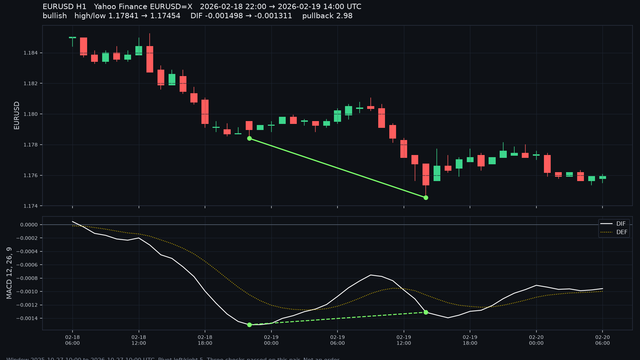
A lower low is not a line. DIF has to fail with it, on the same side of zero, after a real rebound between the two lows.
Direct answer
I keep a bullish divergence line only when three checks pass on closed bars.
Price makes a lower low, and the MACD fast line (DIF) makes a higher low. From the first low through the second, DIF and the signal line (DEF) both stay below zero, and DIF is above DEF on at least one bar. The rebound in DIF clears the higher of the two DIF lows by at least half the gap between those two readings.
The line is not an order. It does not say the next bar rises.
The pair on this page
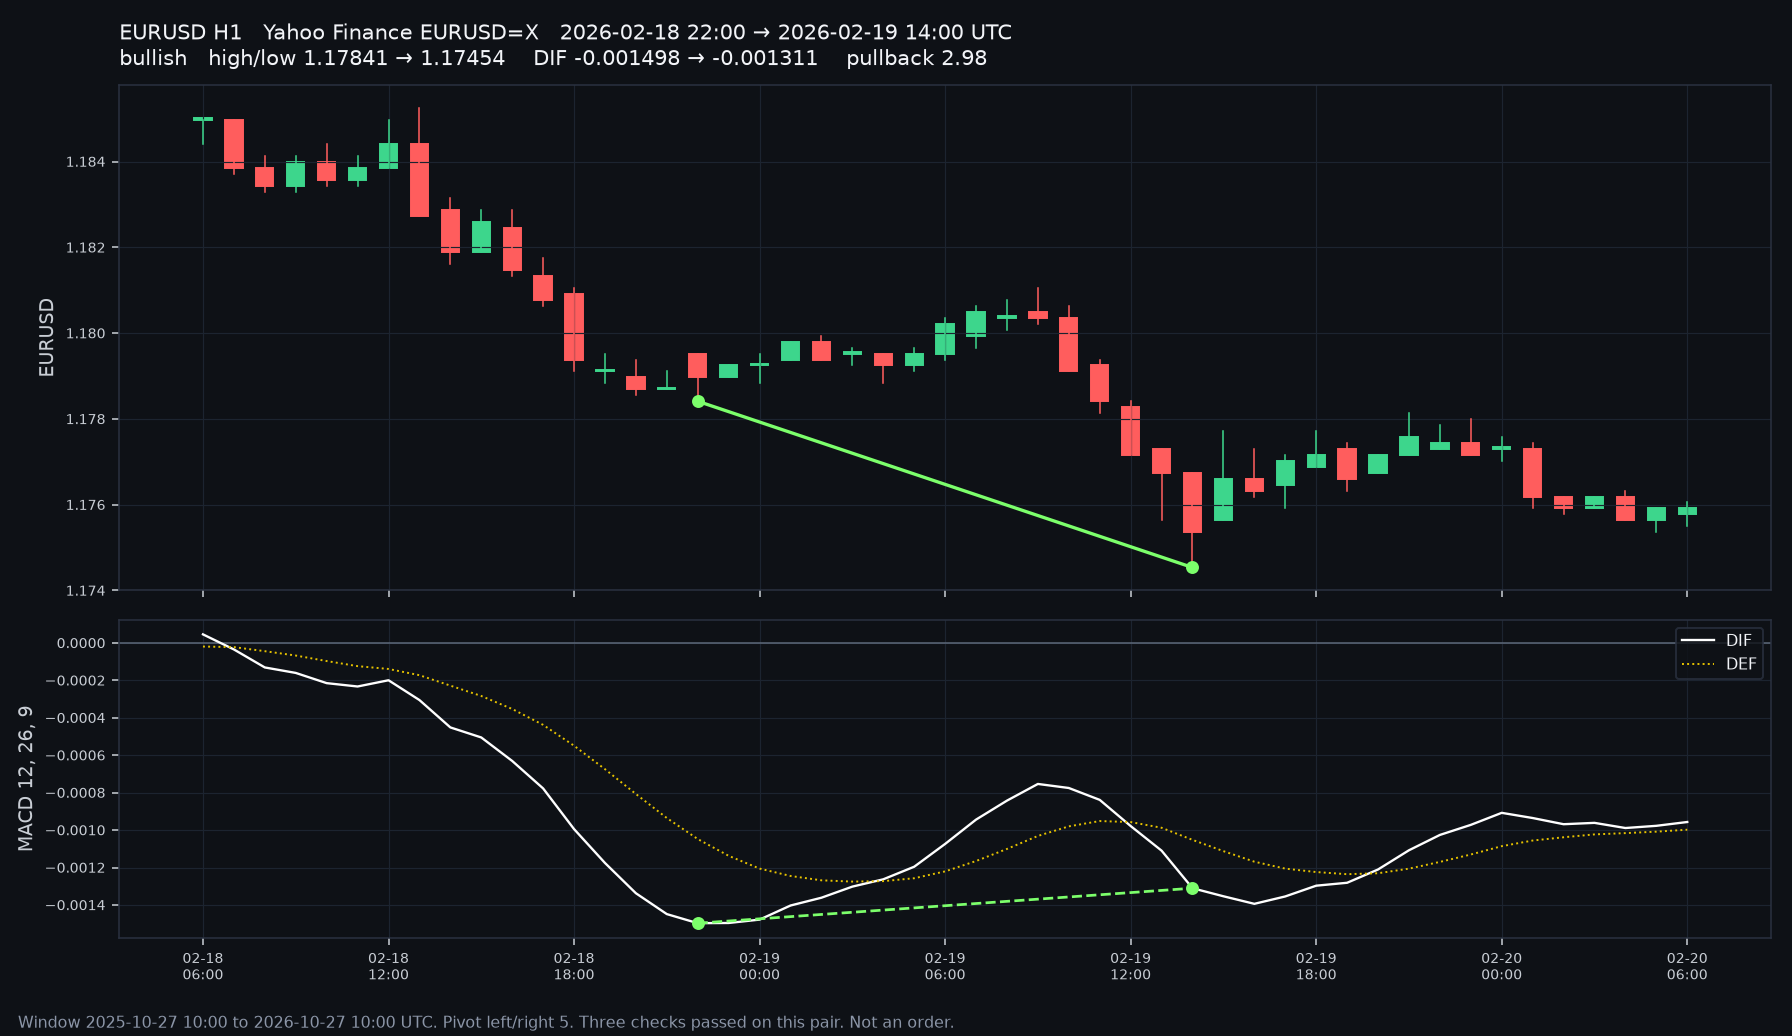
The figure is Yahoo Finance EURUSD=X, one-hour bars, times in UTC. The download runs from 2025-10-27 10:00 through 2026-10-27 10:00 and holds 6,080 hour bars. One unfinished bar that was not on the hour was dropped.
Fast and slow averages are seeded on this download the way MetaTrader seeds an EMA: the first value is a simple average, then an exponential average. DEF equals DIF at bar index 26, then becomes an EMA of 9. A chart that already held a longer history will not match these DIF digits. Use the three checks on your own feed. Do not paste these digits onto another broker's print.
Pivots need five bars on the left and five on the right. MACD is 12, 26, 9. The rebound fraction in the file defaults to 0.5. The file compares consecutive confirmed pivots. It does not compare every pair of lows you can point at.
On this download, with this seed, eighteen consecutive pairs passed. The drawing cap is twenty, so the cap did not hide a later pair. This note checks one pair you can see.
| Hour (UTC) | Role | Low | DIF | DEF |
|---|---|---|---|---|
| 2026-02-18 22:00 | First pivot low | 1.17841 | -0.001498 | -0.001048 |
| 2026-02-19 04:00 | First hour DIF is above DEF | 1.17883 | -0.001263 | -0.001273 |
| 2026-02-19 09:00 | Highest DIF between the lows | 1.18022 | -0.000754 | -0.001031 |
| 2026-02-19 14:00 | Second pivot low | 1.17454 | -0.001311 | -0.001052 |
The second low is 0.00387 under the first. DIF at the second low is 0.000187 above DIF at the first. That is the divergence. It is not yet a line.
Same side of zero
From 22:00 through 14:00 inclusive, the highest DIF is -0.000754 and the highest DEF is -0.000952. Both stay below zero. If either line had reached zero, this pair would fail.
A cross between the lows
At 2026-02-19 04:00, DIF is -0.001263 and DEF is -0.001273. DIF is above DEF. Both numbers are still below zero. The file counts any hour from the first pivot through the second.
A rebound that clears the higher low
The higher of the two DIF lows is -0.001311. The rebound peaks at -0.000754 on 2026-02-19 09:00. It clears that higher low by 0.000557. The gap between the two DIF lows is 0.000187. 0.000557 / 0.000187 = 2.98. The file asks for at least 0.5.
The denominator is the gap between the two pivot readings. It is not the distance from zero down to the first low. A tiny gap can produce a huge fraction. The file still passes that pair. I use this February pair because both the price gap and the DIF gap are visible.
The line is not known at 14:00
The second low needs five closed bars on its right. The lows at 15:00, 16:00, 17:00, 18:00, and 19:00 UTC are 1.17564, 1.17619, 1.17592, 1.17689, and 1.17633. Each one is above 1.17454. The pivot is confirmed when the 19:00 bar closes. Calling the line at 14:00 is early.
What the file does
The MetaTrader 5 file that applies these checks is macd_color_divergence.ex5. It lives on the indicator card: strict MACD divergence. That page asks for an account. This page does not attach the file.
An account does not install the file into BarionQuant Desktop. Desktop is a local practice desk. It is not a broker. This file is not a desktop import.
For study and simulated practice only. This is not investment advice.
When I throw the line out
I throw the line out when the second low is lower and DIF is lower too. I throw it out when DIF or DEF reaches zero between the lows. I throw it out when the rebound does not clear the higher DIF low by half the gap between the two DIF readings. I throw it out when I name it before the five confirming bars have closed.
Who should skip
Skip this page if you want a buy arrow, a direction for the day, or a program that places orders.
Skip it if you will take the file and will not check the two lows yourself.
Keep it if you already draw divergence by eye and you want the three checks written down before you keep the line.
Next step
The closed-bar histogram is a different question: After the close, is the bar getting longer or shorter.
The file is on strict MACD divergence.